What Long Island homes pay in property tax
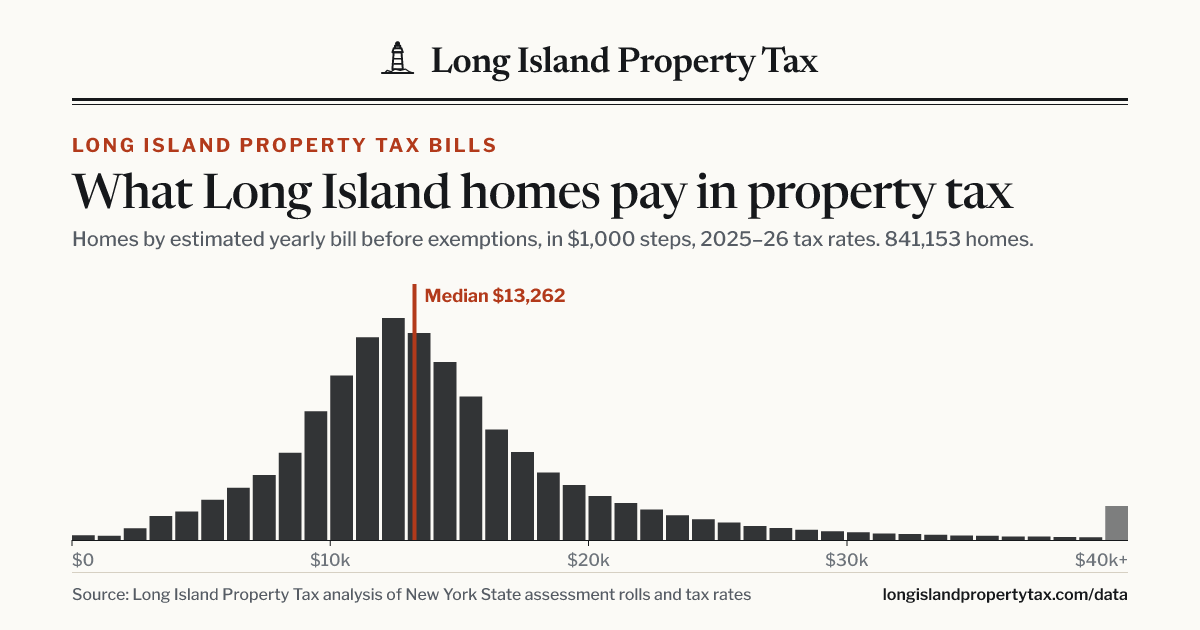
Our report on the property tax bills of 841,153 homes in Nassau and Suffolk, each priced line by line for the 2025–26 tax year. The median bill on a Long Island home is $13,262 a year before exemptions.
The 2025–26 report in brief
- $13,262
The median property tax bill on a Long Island home is $13,262 a year before exemptions such as STAR.
- $10,630–$16,652
Half of Long Island homes have property tax bills between $10,630 and $16,652 a year before exemptions.
- 35%
About 1 in 3 Long Island homes (35%) has a property tax bill of $15,000 or more a year before exemptions.
- $22,023+
One in ten Long Island homes has a property tax bill of $22,023 or more a year before exemptions.
- $34,463 / $6,186
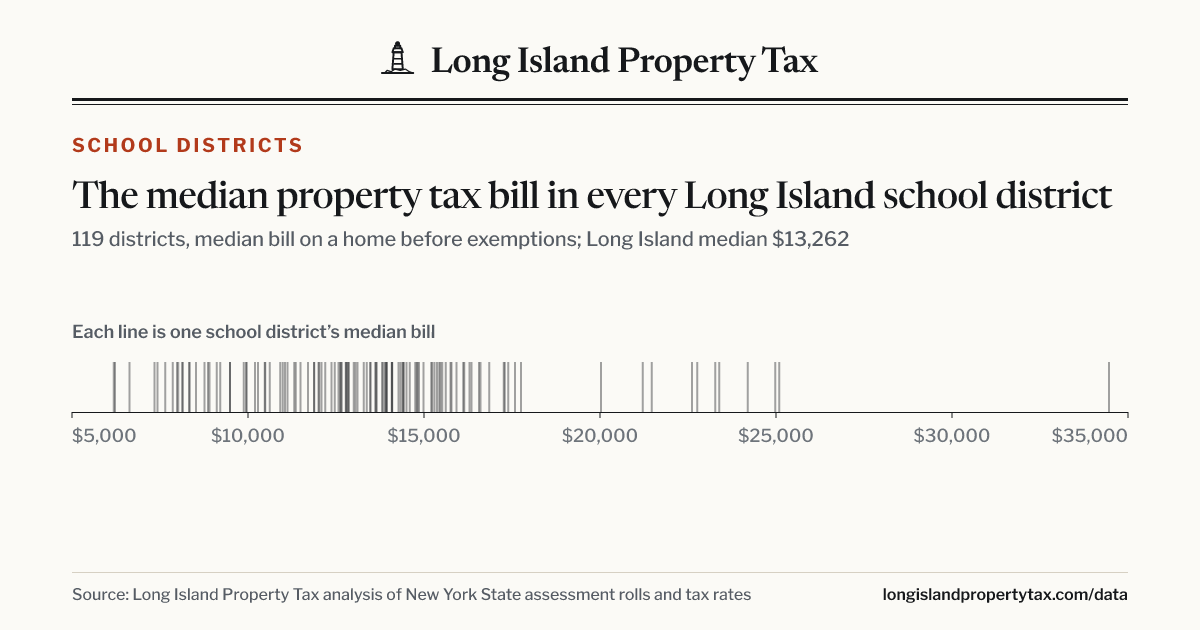
Among Long Island school districts with at least 1,000 homes, the median bill is highest in Cold Spring Harbor ($34,463 a year) and lowest in Oysterponds ($6,186).
- $17,642 / $7,344
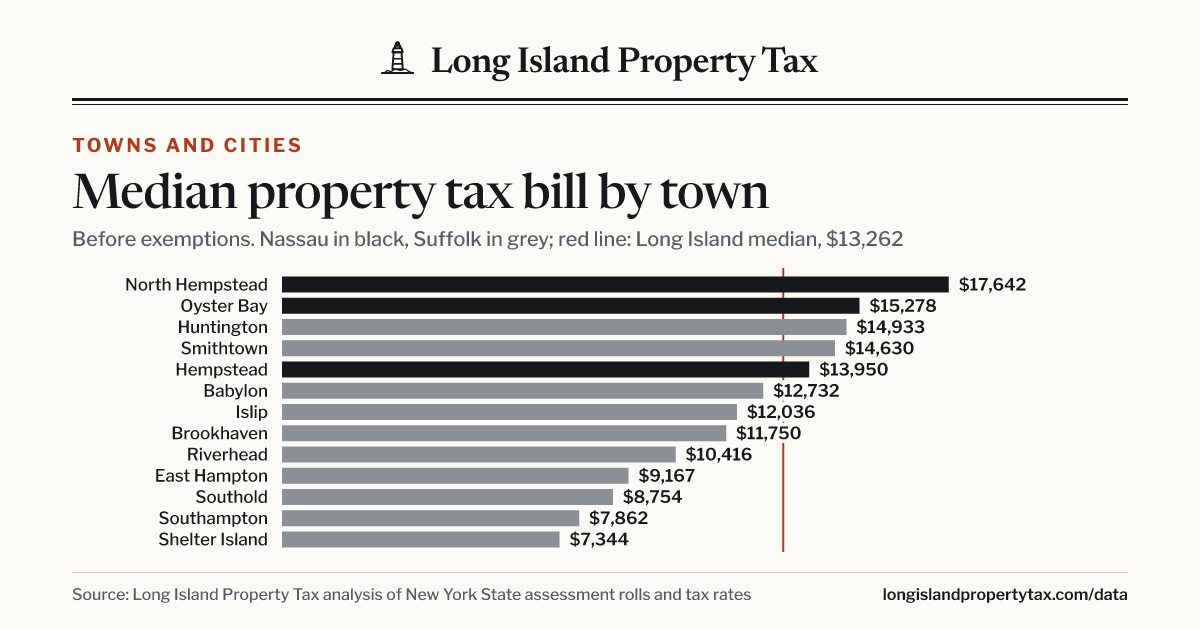
Of Long Island’s towns and cities, the Town of North Hempstead has the highest median property tax bill, $17,642 a year, and the Town of Shelter Island the lowest, $7,344.
- 3 of 121
3 of 121 Long Island school districts proposed 2025–26 tax levies above their state tax-cap limit, which requires 60% voter approval.
- 2.5%
The median Long Island school district proposed raising its 2025–26 tax levy by 2.5%; the districts’ combined levy would rise 2.5%.
Most homes pay between $10,630 and $16,652
The median property tax bill on a Long Island home is $13,262 a year before exemptions; the average is $14,724, pulled up by a long tail of expensive bills. One home in ten pays $22,023 or more, and one in ten pays $7,839 or less.
| Bill | Long Island | Nassau | Suffolk |
|---|---|---|---|
| $10,000+ | 80% | 90% | 71% |
| $15,000+ | 35% | 45% | 27% |
| $20,000+ | 14% | 19% | 10% |
| $25,000+ | 7% | 9% | 4% |
| $30,000+ | 4% | 5% | 2% |
Nassau homes pay $2,215 more at the median
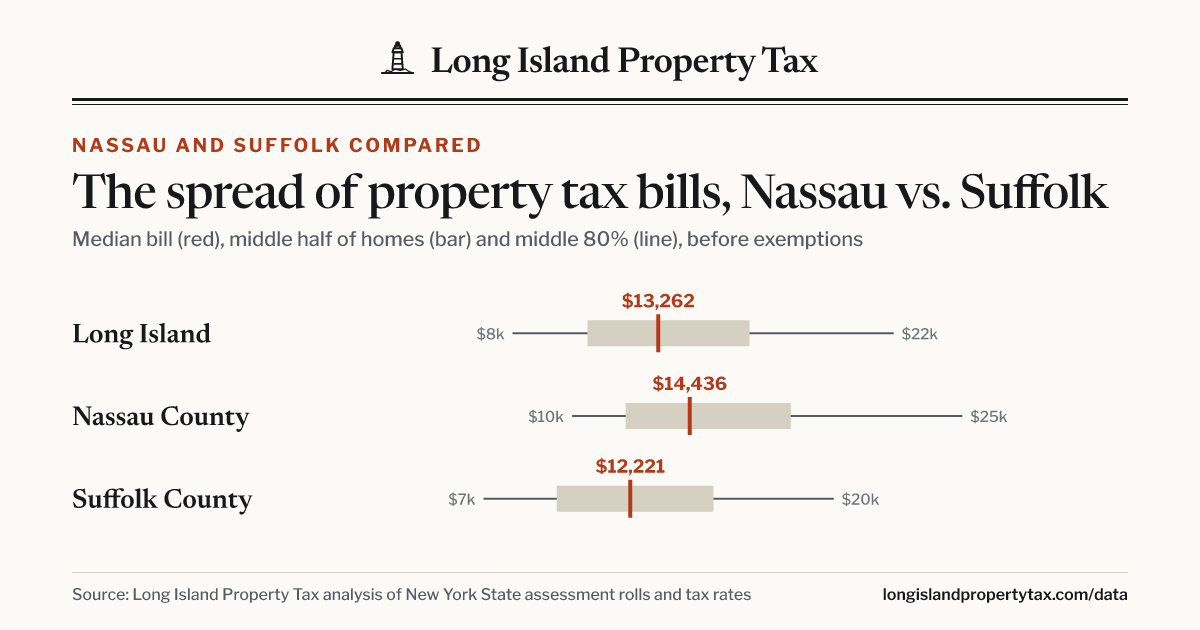
The median bill is $14,436 in Nassau County and $12,221 in Suffolk County. In Nassau, 45% of homes pay $15,000 or more; in Suffolk, 27%.
| Homes | Median | Middle half | |
|---|---|---|---|
| Long Island | 841,153 | $13,262 | $10,630–$16,652 |
| Nassau County | 379,597 | $14,436 | $12,049–$18,189 |
| Suffolk County | 461,556 | $12,221 | $9,480–$15,312 |
Town of North Hempstead has the highest median bill
The median bill in the Town of North Hempstead is $17,642 a year, $10,298 more than in the Town of Shelter Island ($7,344). Within a town the spread is wide too: in the Town of North Hempstead, the middle half of homes pay $13,771 to $23,772.
| # | Town or city | Homes | Median |
|---|---|---|---|
| 1 | Town of North Hempstead | 62,395 | $17,642 |
| 2 | Town of Oyster Bay | 91,401 | $15,278 |
| 3 | Town of Huntington | 64,124 | $14,933 |
| 4 | Town of Smithtown | 36,972 | $14,630 |
| 5 | Town of Hempstead | 204,700 | $13,950 |
| 6 | Town of Babylon | 54,922 | $12,732 |
| 7 | Town of Islip | 83,528 | $12,036 |
| 8 | Town of Brookhaven | 135,627 | $11,750 |
| 9 | Town of Riverhead | 12,527 | $10,416 |
| 10 | Town of East Hampton | 18,797 | $9,167 |
| 11 | Town of Southold | 13,724 | $8,754 |
| 12 | Town of Southampton | 38,821 | $7,862 |
| 13 | Town of Shelter Island | 2,514 | $7,344 |
The school district matters most
School taxes are 64% of what Long Island homeowners pay, so the district a home sits in shapes much of its bill. Among districts with at least 1,000 homes, the median bill ranges from $6,186 in Oysterponds to $34,463 in Cold Spring Harbor.
Highest median bills
| # | District | Homes | Median |
|---|---|---|---|
| 1 | Cold Spring Harbor | 2,723 | $34,463 |
| 2 | East Williston | 2,764 | $25,090 |
| 3 | Roslyn | 5,138 | $24,980 |
| 4 | Jericho | 4,466 | $24,199 |
| 5 | Garden City | 6,588 | $23,390 |
| 6 | Rockville Centre | 5,504 | $23,275 |
| 7 | Syosset | 10,414 | $22,763 |
| 8 | Manhasset | 5,203 | $22,617 |
| 9 | Great Neck | 10,603 | $21,467 |
| 10 | Port Washington | 8,586 | $21,214 |
Lowest median bills
| # | District | Homes | Median |
|---|---|---|---|
| 1 | Oysterponds | 1,655 | $6,186 |
| 2 | Fire Island | 3,674 | $6,224 |
| 3 | Shelter Island | 2,514 | $7,344 |
| 4 | Hampton Bays | 6,265 | $7,431 |
| 5 | Southampton | 8,593 | $7,650 |
| 6 | Montauk | 3,353 | $7,862 |
| 7 | William Floyd | 15,366 | $7,982 |
| 8 | East Quogue | 2,840 | $8,016 |
| 9 | Westhampton Beach | 4,229 | $8,133 |
| 10 | Sag Harbor | 5,577 | $8,148 |
Highest and lowest ZIP codes
Median bill across each ZIP code’s homes, by where the property is. ZIP codes with at least 500 homes.
Highest
| # | ZIP code | Homes | Median |
|---|---|---|---|
| 1 | Old Westbury 11568 | 1,461 | $37,505 |
| 2 | Cold Spring Harbor 11724 | 1,021 | $28,409 |
| 3 | Woodbury 11797 | 2,376 | $27,306 |
| 4 | Roslyn 11576 | 3,843 | $26,645 |
| 5 | Great Neck 11024 | 2,043 | $26,435 |
| 6 | Manhasset 11030 | 5,278 | $24,176 |
| 7 | Jericho 11753 | 3,353 | $23,808 |
| 8 | Lawrence 11559 | 1,905 | $23,192 |
| 9 | Malverne 11565 | 3,110 | $23,033 |
| 10 | Great Neck 11021 | 2,449 | $22,742 |
Lowest
| # | ZIP code | Homes | Median |
|---|---|---|---|
| 1 | Ocean Beach 11770 | 1,194 | $4,503 |
| 2 | East Marion 11939 | 869 | $5,550 |
| 3 | Mastic Beach 11951 | 4,829 | $6,956 |
| 4 | Shelter Island 11964 | 1,300 | $7,024 |
| 5 | Southampton 11968 | 8,595 | $7,223 |
| 6 | Orient 11957 | 785 | $7,278 |
| 7 | Westhampton 11977 | 1,537 | $7,413 |
| 8 | Hampton Bays 11946 | 6,721 | $7,532 |
| 9 | Shelter Island Heights 11965 | 1,211 | $7,844 |
| 10 | Montauk 11954 | 3,352 | $7,883 |
64 cents of every dollar goes to schools
Of the property taxes Long Island homeowners pay, after their exemptions, 64% goes to school districts and 3% to school district libraries. The counties take 11%, the towns 7%, and police, fire, water, sewer, lighting, garbage and other special districts 15%.
School district64%Library3%County11%Town7%Police, fire, water and other districts15%
School levies and the state tax cap
For 2025–26, 3 of Long Island’s 121 school districts proposed a tax levy above its state tax-cap limit, which requires 60% of the vote. The median district proposed a 2.5% levy increase, and the districts’ combined levy rose 2.5%.
Next year: for 2026–27, 7 of 121 districts proposed levies over the cap, and the median proposed increase is 2.4%.
Method, citation and data
Every figure comes from our estimate of each home’s 2025–26 property tax bill, made with the same calculator as the address lookup on this site: line by line from the towns’ tax rate sheets and Nassau County’s tax records for 97% of homes, and from state rate tables for the rest. Medians are of the bill before personal exemptions such as STAR. These are estimates, not tax bills; village taxes are included only where we have the village’s rate. Full method and sources.
The figures update when assessment rolls or tax rates change during the year; this page shows when it was last updated. When the next tax year begins, this edition is kept as published at longislandpropertytax.com/long-island-property-tax-report/2025-26.
How to cite
Citation
Long Island Property Tax, “The 2025–26 Long Island Property Tax Report,” longislandpropertytax.com/long-island-property-tax-report/2025-26, updated October 15, 2026.
The data is free to use with credit (CC BY 4.0). Download it as CSV or JSON, or email read@longislandpropertytax.com with questions.