Nassau & Suffolk Counties, New York Nassau grievance deadline March 31, 2027Nassau grievance deadline Mar 31

For reporters and researchers

Long Island property tax data

What Long Island homes pay in property tax, by county, town, school district and ZIP code, from our estimate of every home’s bill. Quote it, chart it, download it: it’s free to use with credit.

Updated
October 15, 2026
Tax year
2025–26
Homes priced
841,153
License
CC BY 4.0
Key numbers

Figures you can quote

Each one is written to be used as is, with its basis underneath. Copy the sentence with its credit, or link straight to the figure.

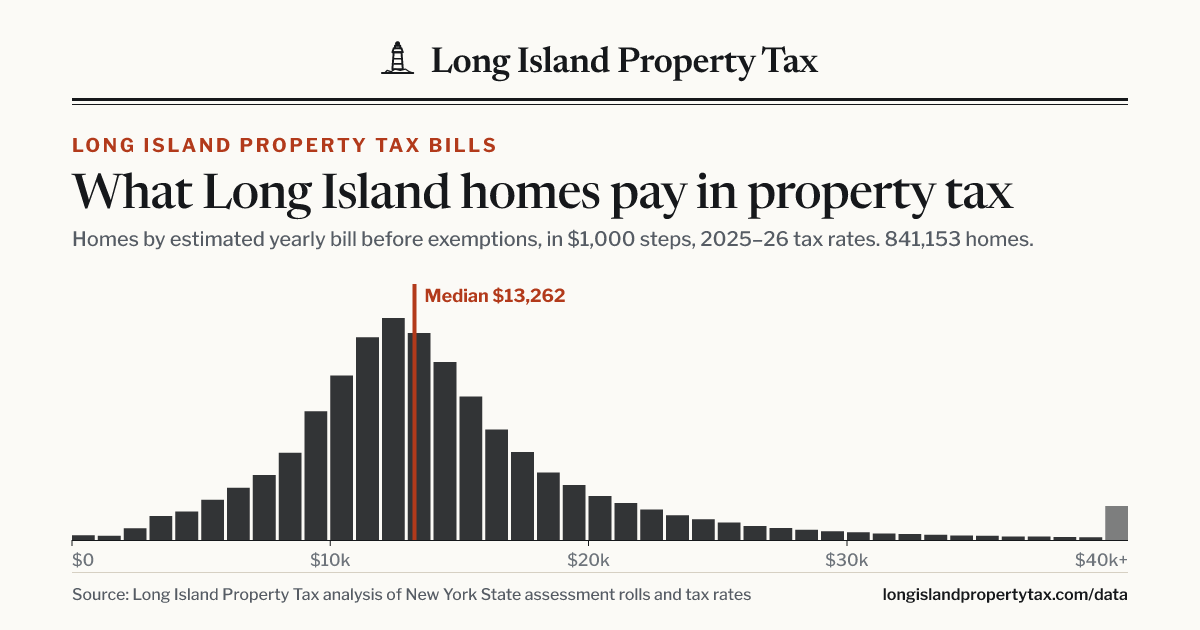
Median bill, Long Island

$13,262

The median property tax bill on a Long Island home is $13,262 a year before exemptions such as STAR.

Long Island Property Tax estimates for 841,153 homes in Nassau and Suffolk counties, 2025–26 tax rates, before exemptions.

Link to this

Nassau vs. Suffolk

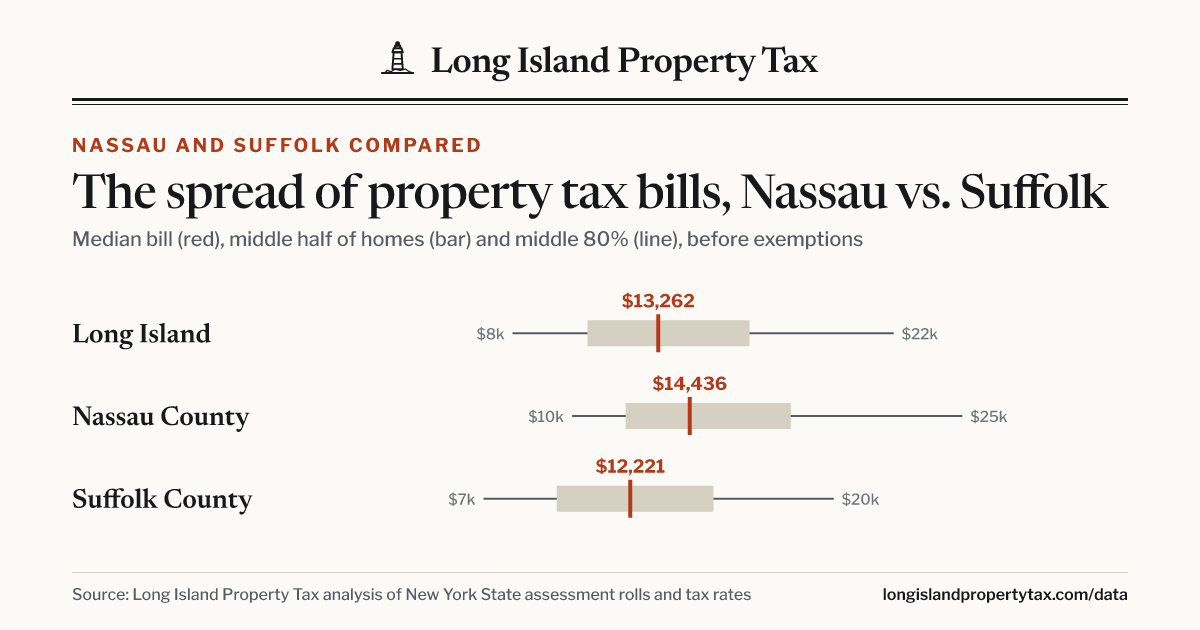
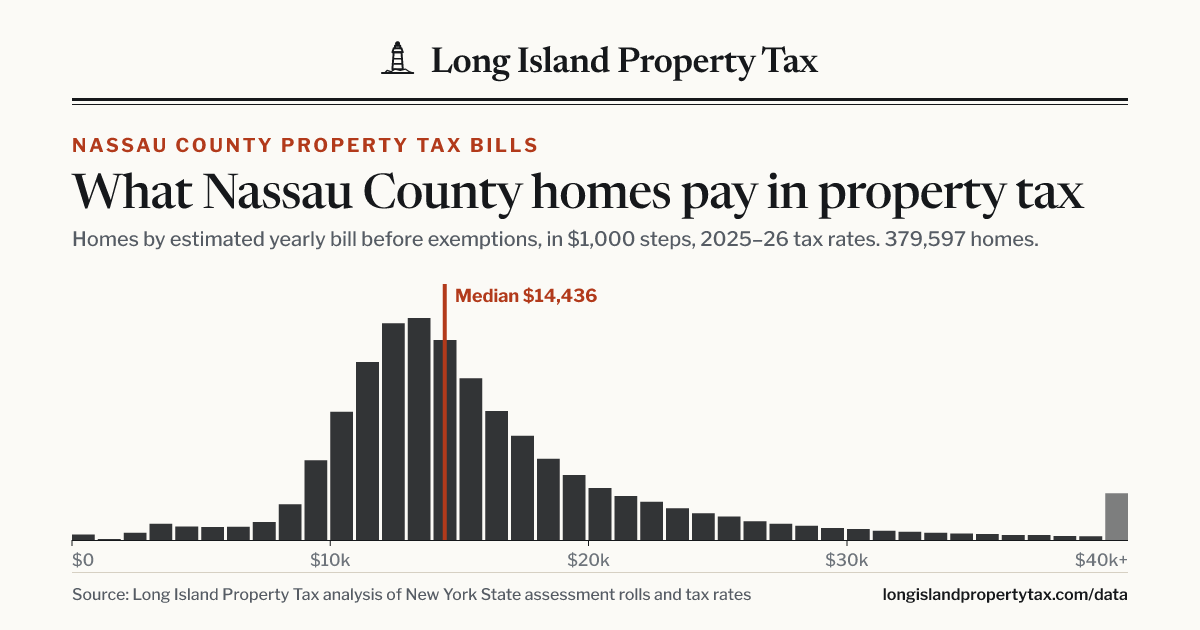
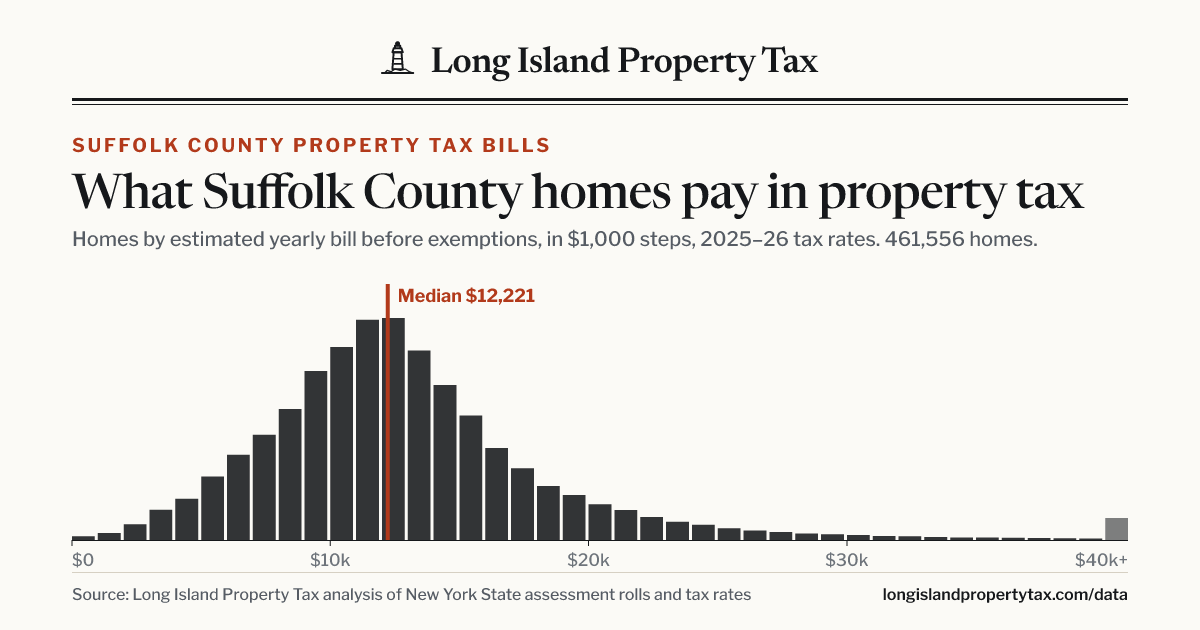
$14,436 / $12,221

The median property tax bill on a home is $14,436 a year in Nassau County and $12,221 in Suffolk County, before exemptions.

Long Island Property Tax estimates for 841,153 homes in Nassau and Suffolk counties, 2025–26 tax rates, before exemptions.

Link to this

Middle half of homes

$10,630–$16,652

Half of Long Island homes have property tax bills between $10,630 and $16,652 a year before exemptions.

Long Island Property Tax estimates for 841,153 homes in Nassau and Suffolk counties, 2025–26 tax rates, before exemptions.

Link to this

Bills of $15,000 or more

35%

About 1 in 3 Long Island homes (35%) has a property tax bill of $15,000 or more a year before exemptions.

Long Island Property Tax estimates for 841,153 homes in Nassau and Suffolk counties, 2025–26 tax rates, before exemptions.

Link to this

Top tenth of homes

$22,023+

One in ten Long Island homes has a property tax bill of $22,023 or more a year before exemptions.

Long Island Property Tax estimates for 841,153 homes in Nassau and Suffolk counties, 2025–26 tax rates, before exemptions.

Link to this

Share going to schools

64%

School district taxes make up 64% of the property taxes Long Island homeowners pay, and school district libraries another 3%.

Long Island Property Tax estimates of each home’s bill, line by line, 2025–26 tax rates, after owners’ exemptions.

Link to this

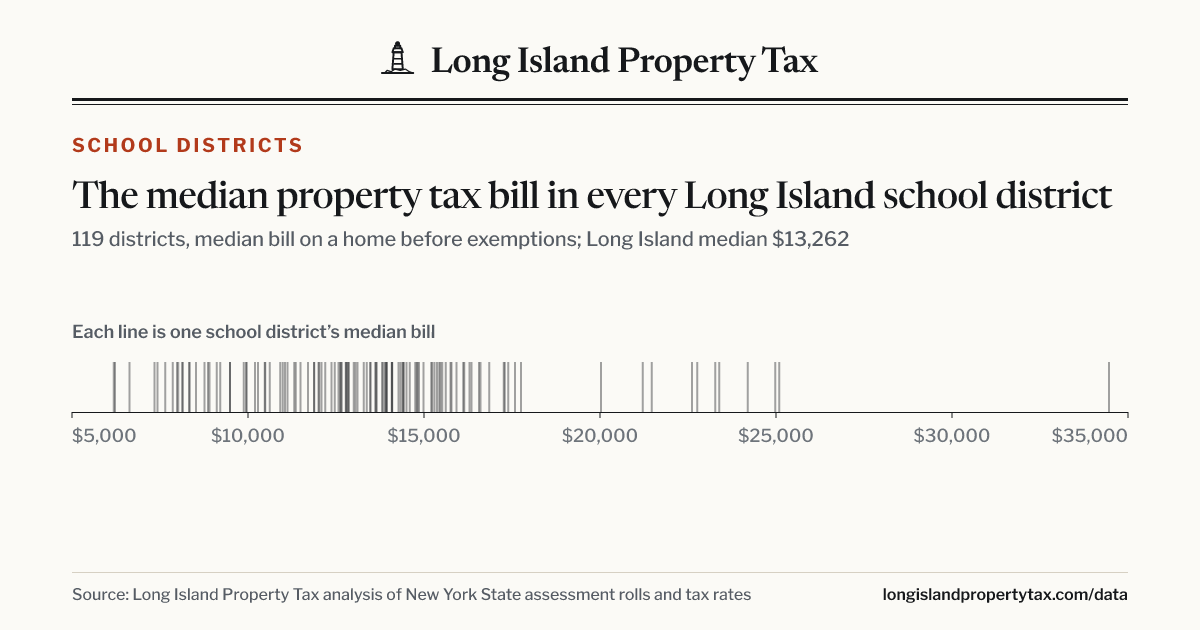
School districts, highest and lowest

$34,463 / $6,186

Among Long Island school districts with at least 1,000 homes, the median bill is highest in Cold Spring Harbor ($34,463 a year) and lowest in Oysterponds ($6,186).

Long Island Property Tax estimates for 841,153 homes in Nassau and Suffolk counties, 2025–26 tax rates, before exemptions.

Link to this

Towns, highest and lowest

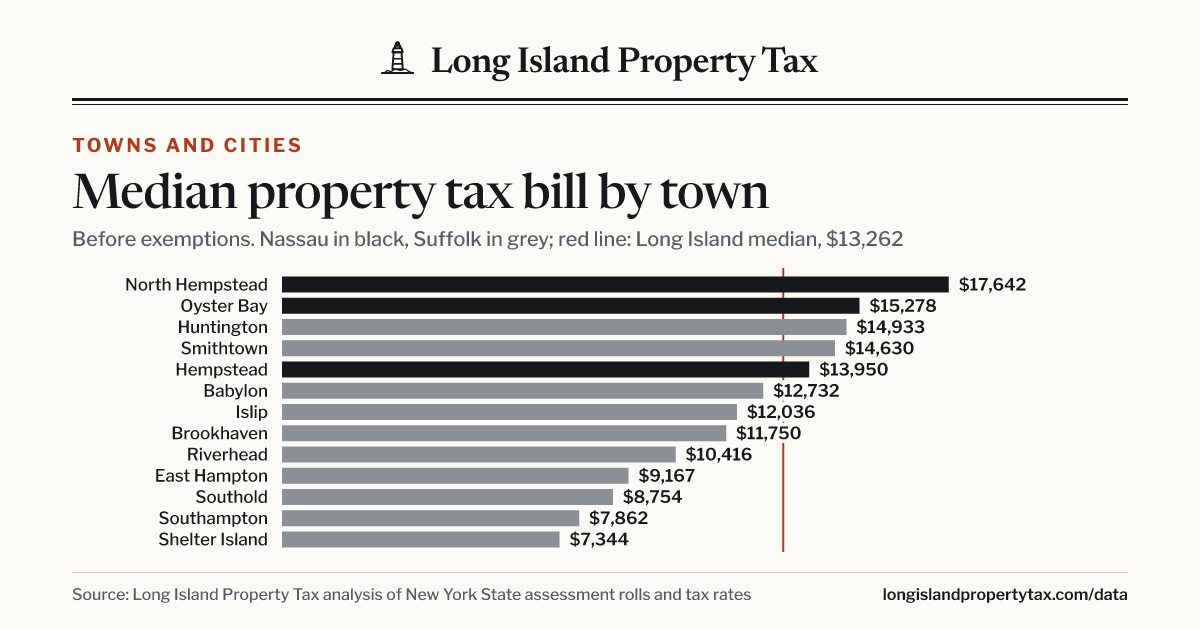
$17,642 / $7,344

Of Long Island’s towns and cities, the Town of North Hempstead has the highest median property tax bill, $17,642 a year, and the Town of Shelter Island the lowest, $7,344.

Long Island Property Tax estimates for 841,153 homes in Nassau and Suffolk counties, 2025–26 tax rates, before exemptions.

Link to this

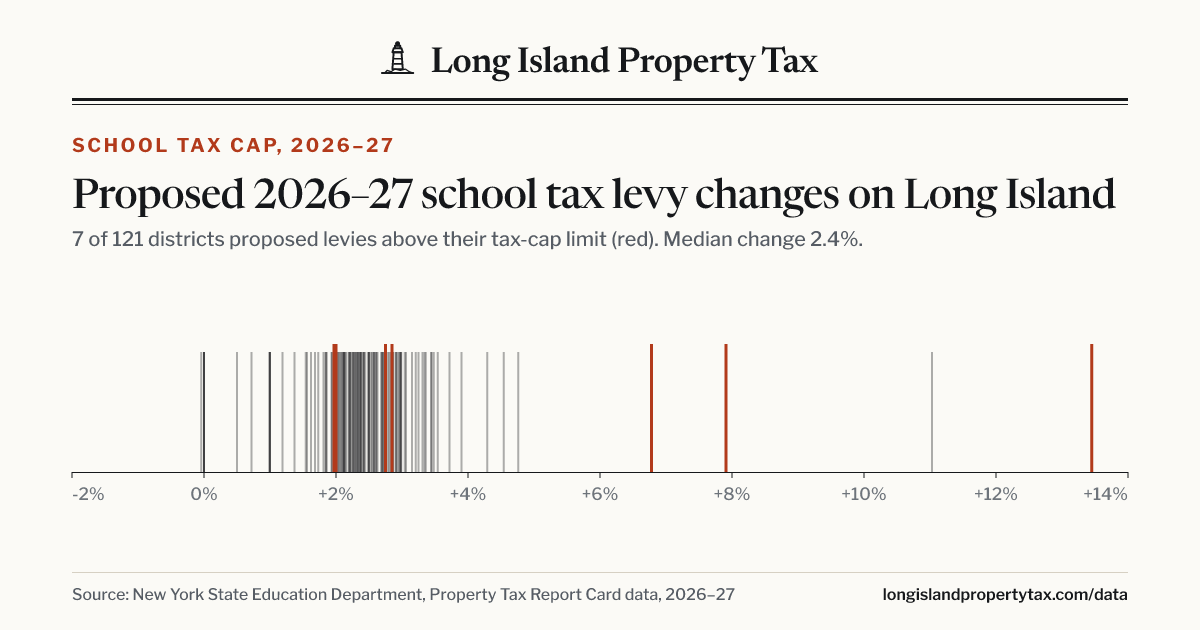
Over the tax cap, 2026–27

7 of 121

7 of 121 Long Island school districts proposed 2026–27 tax levies above their state tax-cap limit, which requires 60% voter approval.

New York State Education Department Property Tax Report Card data, 2026–27.

Details

Median levy increase, 2026–27

2.4%

The median Long Island school district proposed raising its 2026–27 tax levy by 2.4%; the districts’ combined levy would rise 2.5%.

New York State Education Department Property Tax Report Card data, 2026–27.
Details
Charts

Charts to download

1200 × 630 images with the source drawn in, so the credit travels with the chart. They update with the data.

What Long Island homes pay in property tax
What Long Island homes pay in property taxPNG
Nassau vs. Suffolk: median and middle half of bills
Nassau vs. Suffolk: median and middle half of billsPNG
Median property tax bill by town
Median property tax bill by townPNG
What Nassau County homes pay in property tax
What Nassau County homes pay in property taxPNG
What Suffolk County homes pay in property tax
What Suffolk County homes pay in property taxPNG
Median bill in every Long Island school district
Median bill in every Long Island school districtPNG
Proposed 2026–27 school tax levy changes
Proposed 2026–27 school tax levy changesPNG
Downloads

The data behind the numbers

Spreadsheet-ready CSV files. Every row carries the tax year, the date it was computed and the source.

  • School districts

    Median, middle half and mean bill for each school district with at least 50 priced homes, and the share of the bill that goes to the district. 119 rows.

    CSV
  • Towns and cities

    Median, middle half and mean bill for each of Long Island’s 13 towns and 2 cities. 13 rows.

    CSV
  • ZIP codes

    Median, middle half and mean bill for each Long Island ZIP code with at least 100 priced homes, by where the property is (not the owner’s mailing ZIP). 169 rows.

    CSV
  • Long Island and the two counties

    Percentiles, mean, share of homes over $10,000 to $30,000, and where the money goes, for Long Island, Nassau and Suffolk. 3 rows.

    CSV
  • How many homes pay how much

    Homes by bill in $1,000 steps, for Long Island and each county (the last row is $40,000 and up). 41 rows.

    CSV
  • School tax cap, 2026–27

    Each district’s proposed budget and levy, its levy limit and whether it is over the cap, from NYSED’s Property Tax Report Card data. 121 rows.

    CSV
  • Everything as JSON

    All of the above in one file, plus the quotable figures on this page (facts.json).

    JSON

Free to use, including commercially, with credit. The data and charts are licensed CC BY 4.0. Credit “Long Island Property Tax” and link to longislandpropertytax.com where you can.

Rankings

Highest and lowest bills

Median bill on a home before exemptions. School districts with at least 1,000 homes; ZIP codes with at least 500.

Highest school districts

#DistrictHomesMedian bill
1Cold Spring Harbor Suffolk2,723$34,463
2East Williston Nassau2,764$25,090
3Roslyn Nassau5,138$24,980
4Jericho Nassau4,466$24,199
5Garden City Nassau6,588$23,390
6Rockville Centre Nassau5,504$23,275
7Syosset Nassau10,414$22,763
8Manhasset Nassau5,203$22,617
9Great Neck Nassau10,603$21,467
10Port Washington Nassau8,586$21,214

Lowest school districts

#DistrictHomesMedian bill
1Oysterponds Suffolk1,655$6,186
2Fire Island Suffolk3,674$6,224
3Shelter Island Suffolk2,514$7,344
4Hampton Bays Suffolk6,265$7,431
5Southampton Suffolk8,593$7,650
6Montauk Suffolk3,353$7,862
7William Floyd Suffolk15,366$7,982
8East Quogue Suffolk2,840$8,016
9Westhampton Beach Suffolk4,229$8,133
10Sag Harbor Suffolk5,577$8,148

Towns and cities

#Town or cityCountyHomesMiddle halfMedian bill
1Town of North HempsteadNassau62,395$13,771–$23,772$17,642
2Town of Oyster BayNassau91,401$12,879–$19,618$15,278
3Town of HuntingtonSuffolk64,124$11,728–$19,245$14,933
4Town of SmithtownSuffolk36,972$12,374–$17,365$14,630
5Town of HempsteadNassau204,700$11,876–$16,745$13,950
6Town of BabylonSuffolk54,922$10,934–$14,714$12,732
7Town of IslipSuffolk83,528$10,118–$14,265$12,036
8Town of BrookhavenSuffolk135,627$9,290–$14,412$11,750
9Town of RiverheadSuffolk12,527$7,277–$14,139$10,416
10Town of East HamptonSuffolk18,797$6,700–$13,517$9,167
11Town of SoutholdSuffolk13,724$6,756–$12,099$8,754
12Town of SouthamptonSuffolk38,821$5,291–$13,605$7,862
13Town of Shelter IslandSuffolk2,514$5,505–$12,038$7,344

Full rankings: school districts, ZIP codes, or download every place.

Tax cap tracker

7 of 121 districts proposed levies over the cap for 2026–27

Every Long Island school district’s proposed 2026–27 budget and tax levy against its state tax-cap limit, from the State Education Department’s Property Tax Report Card data. The median district proposed a 2.4% levy increase.

See every district

Method

How the numbers are made

We estimate the property tax bill for every home on Long Island: each residential property on New York State’s assessment roll for Nassau and Suffolk (847,826 one-, two- and three-family houses and other residential classes; apartment and co-op buildings are not included), using the same calculator as the address lookup on this site.

  • Line by line where we can. 97% of homes are priced from the towns’ own tax rate sheets (all ten Suffolk towns) and Nassau County’s tax records: assessed value times each school, town, county, fire, library, water, sewer and lighting district’s rate, plus flat charges like garbage districts.
  • The rest from state rate tables. Where the town or county rate data doesn’t cover a home, it is priced from New York State’s published tax rates and an estimate of market value from recent sales, with a correction for special districts measured against real bills.
  • Before exemptions. Medians and rankings use each home’s bill before personal exemptions such as STAR, senior and veterans’ exemptions: the bill on the house itself, what a buyer would pay in the first year, and the same basis for every home. “Where the money goes” uses the bills owners pay, with their exemptions.
  • Special districts in Suffolk. Fire, water, library and similar districts depend on exactly where a home sits. Where we have already placed a home on the district maps, we use that; otherwise its bill uses the combination of districts, among those it could be in, that covers the most taxable value. So a single home’s figure here can differ from its own address page, which looks the location up.
  • Where a property is. Towns and ZIP codes are by the property’s own location from the county parcel maps, not the owner’s mailing address.

What to keep in mind

  • These are estimates, not tax bills. Incorporated village taxes are estimated where we have the village’s rate and otherwise not included, so bills in villages can run higher.
  • Medians for places with few homes swing more; we don’t publish a median for a school district with fewer than 50 homes or a town or ZIP code with fewer than 100, and we rank only places with at least 500 to 1,000.
  • The numbers recalculate on their own whenever new assessment rolls, tax rates or sales are loaded. The date at the top of this page is when they were last computed.

Sources: New York State assessment rolls and tax rates, the ten Suffolk towns’ tax rate sheets, Nassau County’s tax records, the counties’ parcel maps, and the State Education Department’s Property Tax Report Card data. More on the calculator: how the estimate works.

Talk to us

Working on a story?

Email read@longislandpropertytax.com for a quote, a custom cut of the data (a village, a neighborhood, a list of addresses) or help checking a figure. We reply within a day or two, usually sooner.

Put the numbers on your own page: our free widgets add a property tax lookup or a school district’s figures to any site.