Which Long Island school districts are over the tax cap?
4 of 121 Long Island school districts proposed 2024–25 tax levies above their state tax-cap limit, so their budgets need 60% of the vote to pass. The median district proposed raising its levy +2.5%.
This is the 2024–25 school year. See the latest year.
- Over the cap
- 4of 121
- Nassau 1, Suffolk 3
- Median levy change
- +2.5%
- proposed, per district
- Median budget change
- +3.7%
- proposed, per district
- Combined school levy
- $9.77billion
- +2.5% from last year
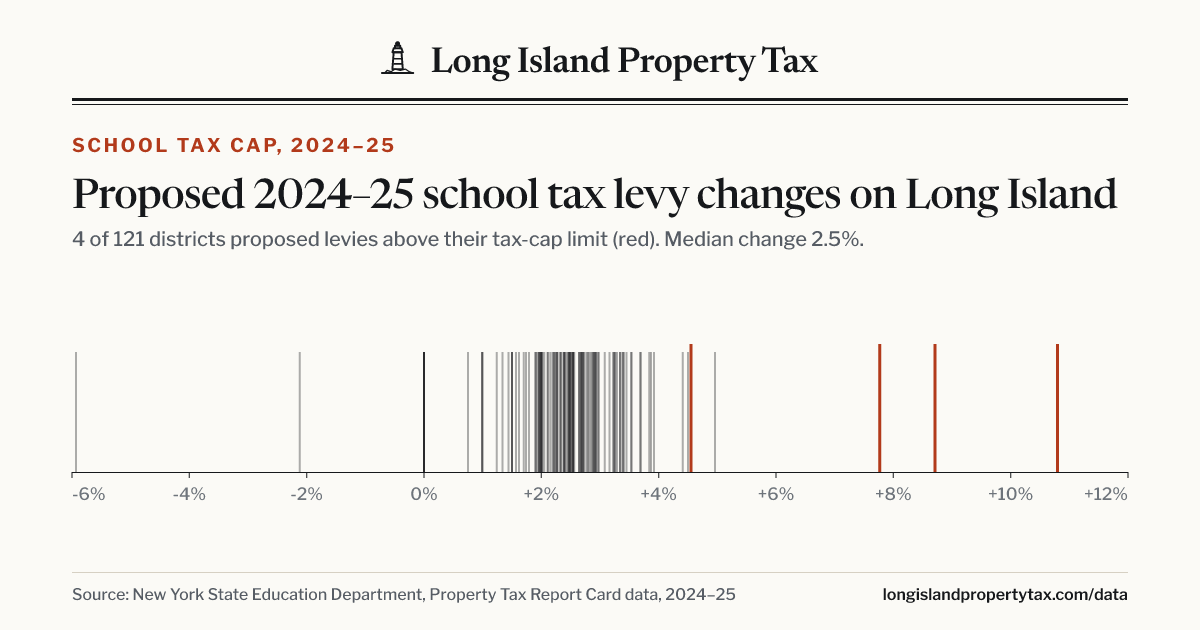
4 districts need a 60% supermajority
Proposed 2024–25 budgets and levies
Sorted by the proposed levy change. Click a column to sort. Download as CSV.
| Tax cap | |||
|---|---|---|---|
| Springs | $33.9M | +10.8% | Over |
| East Hampton | $62.3M | +8.7% | Over |
| Amagansett | $11.9M | +7.8% | Over |
| Eastport-South Manor | $64.7M | +5.0% | Within |
| Port Washington | $161.5M | +4.5% | Over |
| Oysterponds | $4.9M | +4.5% | Within |
| Tuckahoe Common | $20.2M | +4.4% | Within |
| Bayport-Blue Point | $62.0M | +3.9% | Within |
| North Shore | $92.5M | +3.9% | Within |
| Greenport | $18.3M | +3.8% | Within |
| Sayville | $66.0M | +3.7% | Within |
| East Williston | $61.4M | +3.7% | Within |
| Southampton | $63.9M | +3.5% | Within |
| Quogue | $8.9M | +3.5% | Within |
| Hicksville | $115.5M | +3.5% | Within |
| Uniondale | $134.6M | +3.4% | Within |
| Plainview-Old Bethpage | $143.2M | +3.4% | Within |
| Hauppauge | $96.7M | +3.4% | Within |
| Bridgehampton | $19.0M | +3.3% | Within |
| Riverhead | $107.8M | +3.3% | Within |
| Connetquot | $143.8M | +3.3% | Within |
| Great Neck | $237.0M | +3.3% | Within |
| Jericho | $115.5M | +3.3% | Within |
| East Meadow | $156.4M | +3.2% | Within |
| Mount Sinai | $46.5M | +3.2% | Within |
| Syosset | $226.5M | +3.2% | Within |
| Amityville | $65.8M | +3.1% | Within |
| Copiague | $69.6M | +3.0% | Within |
| Westhampton Beach | $34.6M | +3.0% | Within |
| Levittown | $158.8M | +2.9% | Within |
| Huntington | $117.0M | +2.9% | Within |
| Remsenburg-Speonk | $14.3M | +2.9% | Within |
| Mattituck-Cutchogue | $41.0M | +2.9% | Within |
| Sag Harbor | $43.3M | +2.9% | Within |
| North Babylon | $74.3M | +2.9% | Within |
| New Hyde Park-Garden City | $34.4M | +2.9% | Within |
| Smithtown | $219.4M | +2.9% | Within |
| Three Village | $174.1M | +2.8% | Within |
| Southold | $30.3M | +2.8% | Within |
| Roslyn | $106.6M | +2.8% | Within |
| Glen Cove | $77.3M | +2.8% | Within |
| Floral Park-Bellerose | $27.5M | +2.7% | Within |
| Wantagh | $67.1M | +2.7% | Within |
| Rocky Point | $56.8M | +2.7% | Within |
| South Country | $69.1M | +2.7% | Within |
| Fire Island | $5.3M | +2.7% | Within |
| Manhasset | $99.7M | +2.7% | Within |
| North Merrick | $26.1M | +2.7% | Within |
| Patchogue-Medford | $131.3M | +2.7% | Within |
| East Quogue | $25.9M | +2.6% | Within |
| Farmingdale | $140.4M | +2.6% | Within |
| Fishers Island | $3.7M | +2.6% | Within |
| Bellmore-Merrick Central HSD | $133.2M | +2.5% | Within |
| Garden City | $112.0M | +2.5% | Within |
| Half Hollow Hills | $230.2M | +2.5% | Within |
| Middle Country | $160.0M | +2.5% | Within |
| Shoreham-Wading River | $58.9M | +2.5% | Within |
| Brentwood | $114.4M | +2.5% | Within |
| Elmont | $58.0M | +2.5% | Within |
| Rockville Centre | $106.5M | +2.5% | Within |
| Babylon | $47.8M | +2.5% | Within |
| Center Moriches | $26.3M | +2.5% | Within |
| Sewanhaka Central HSD | $166.2M | +2.5% | Within |
| Bellmore | $28.4M | +2.5% | Within |
| Harborfields | $74.0M | +2.4% | Within |
| Oyster Bay-East Norwich | $58.2M | +2.4% | Within |
| South Huntington | $126.6M | +2.4% | Within |
| North Bellmore | $43.7M | +2.4% | Within |
| Herricks | $107.3M | +2.4% | Within |
| Kings Park | $82.0M | +2.4% | Within |
| West Hempstead | $50.6M | +2.3% | Within |
| Northport-East Northport | $157.2M | +2.3% | Within |
| Shelter Island | $11.5M | +2.3% | Within |
| Baldwin | $106.4M | +2.3% | Within |
| Lindenhurst | $112.8M | +2.3% | Within |
| Seaford | $59.9M | +2.3% | Within |
| Bethpage | $71.5M | +2.2% | Within |
| Carle Place | $46.9M | +2.2% | Within |
| Franklin Square | $31.7M | +2.2% | Within |
| Lynbrook | $76.6M | +2.2% | Within |
| Bay Shore | $117.9M | +2.2% | Within |
| Merrick | $45.5M | +2.1% | Within |
| Hampton Bays | $48.6M | +2.1% | Within |
| Miller Place | $52.1M | +2.1% | Within |
| Island Trees | $49.7M | +2.0% | Within |
| Elwood | $53.1M | +2.0% | Within |
| West Babylon | $84.3M | +2.0% | Within |
| Malverne | $48.7M | +2.0% | Within |
| Mineola | $87.2M | +2.0% | Within |
| Commack | $155.7M | +2.0% | Within |
| Island Park | $34.3M | +2.0% | Within |
| East Rockaway | $33.4M | +2.0% | Within |
| Islip | $67.0M | +2.0% | Within |
| Locust Valley | $88.1M | +2.0% | Within |
| Plainedge | $70.0M | +1.9% | Within |
| Sachem | $211.9M | +1.9% | Within |
| East Moriches | $22.0M | +1.9% | Within |
| Massapequa | $178.8M | +1.9% | Within |
| Longwood | $159.4M | +1.8% | Within |
| Deer Park | $79.5M | +1.7% | Within |
| Valley Stream 24 | $23.0M | +1.7% | Within |
| Cold Spring Harbor | $70.7M | +1.6% | Within |
| Oceanside | $130.3M | +1.6% | Within |
| Central Islip | $92.7M | +1.5% | Within |
| East Islip | $75.8M | +1.5% | Within |
| Long Beach | $109.1M | +1.5% | Within |
| West Islip | $93.4M | +1.4% | Within |
| Brookhaven-Comsewogue | $64.2M | +1.3% | Within |
| Port Jefferson | $39.8M | +1.2% | Within |
| Roosevelt | $24.3M | +1.0% | Within |
| Valley Stream Central HSD | $88.8M | +1.0% | Within |
| William Floyd | $81.2M | +1.0% | Within |
| Valley Stream 13 | $39.1M | +0.8% | Within |
| Hempstead | $75.9M | 0.0% | Within |
| Hewlett-Woodmere | $108.6M | 0.0% | Within |
| Lawrence | $86.0M | 0.0% | Within |
| Valley Stream 30 | $22.8M | 0.0% | Within |
| Westbury | $78.2M | 0.0% | Within |
| Wyandanch | $23.1M | 0.0% | Within |
| Freeport | $87.2M | -2.1% | Within |
| Montauk | $19.0M | -5.9% | Within |
“Levy” is the total proposed school year tax levy; “Tax cap” compares the levy without its permissible exclusions to the district’s tax levy limit, as on the report card.
The tax cap in brief
New York’s property tax cap, in force since 2012, limits how much a school district’s tax levy can grow each year: generally to 2% or the rate of inflation, whichever is less, adjusted for growth in the tax base and money carried over from earlier years. Some costs, such as voter-approved capital projects and part of pension increases, are excluded from the limit.
A budget whose levy, leaving out those exclusions, is at or under the district’s limit passes with a simple majority. A budget over the limit needs at least 60% of the vote. If voters reject a budget twice, the district must adopt a contingency budget with no increase in its tax levy.
Every district files its numbers on a Property Tax Report Card before the May vote, and the State Education Department publishes them. This tracker reads that file for every Long Island district and checks it daily through the spring. See the data page for what homeowners pay, or a district’s page for its median bill.